When the Manager Changes Jobs, the Fund Moves TooQuando o Gestor Troca de Emprego, o Fundo Vai Junto
A 2003 identification idea, follow the managers who move, applied to 37,455 manager switches in the Brazilian fund industry. When a fund changes management firms, its portfolio changes address too.
Uma ideia de identificação de 2003, seguir quem se muda, aplicada a 37.455 trocas de gestor na indústria brasileira de fundos. Quando o fundo troca de casa, a carteira se muda de endereço junto.

In 2003, Marianne Bertrand and Antoinette Schoar published a paper in the Quarterly Journal of Economics around a question that looks impossible to settle. When a company invests cautiously, borrows heavily, or runs a lean balance sheet, is that the company’s way of doing things, or the person in charge?
The clean experiment is unavailable, since nobody gets to assign executives to firms at random. What Bertrand and Schoar did instead was assemble a panel matching managers to the firms they ran, and then lean on the executives who changed jobs. If style belongs to the person, it should travel with them: same manager, same habits, different letterhead. They found that it largely does. A good share of what had been filed under the firm’s account turned out to belong to whoever was running it.
The idea travels. Brazil’s fund industry runs that natural experiment at a scale no corporate panel can reach: in CVM filings between 2005 and 2026 there are 37,455 manager switches across 24,217 funds, each one a portfolio changing hands with its holdings reported on both sides of the move.
There is also a practical reason to care. A manager switch is filed with the regulator as a registry update. It is public, and it is not announced to investors as a change to the product, because formally it is not one. Whether it is one in practice is a different question.
What we did
The base is the full CVM universe: 55,653 funds, 3.7 million fund-month observations, 2005 to 2026, including the funds that have since closed.
Comparing two funds takes a number, and ours is the share of the portfolio that would have to change hands for one to turn into the other:
\[d(f,g) \;=\; \frac{1}{2}\sum_{k=1}^{K}\bigl|\,w_{fk} - w_{gk}\,\bigr|\]
Here wfk is the fraction of fund f’s portfolio sitting in asset class k. Two funds holding the same things in the same proportions give d = 0, and two funds with nothing in common give d = 1. The distances below run around 0.45, which is to say that roughly 45% of the portfolio differs.
For each management firm, in each half-year, we built its book: what that firm’s funds hold, on average, across asset classes. Then, for every fund that switched firms, we measured its distance to two books, the incoming firm’s and the outgoing firm’s, in the half-year before the switch and in the half-year after. The half-year of the switch itself is skipped, so that the transition does not get mistaken for the result.
One detail carries the whole test: each firm’s book excludes the fund being measured. Without that, a fund joining a small firm would drag the average toward itself, and any convergence we saw would be arithmetic.
What we found
Both distances move, in opposite directions, by almost exactly the same amount.
| before | after | ||
|---|---|---|---|
| distance to the incoming firm’s book | 0.446 | 0.409 | moves closer |
| distance to the outgoing firm’s book | 0.421 | 0.459 | moves away |
The difference in differences is −0.075, with a t statistic of −31, over the 5,585 switches through 2023 for which all four books can be estimated. The mirror image is what makes it readable. A fund churning at random would not produce it. A fund changing address would.
The obvious objection has a name, regression to the mean. A fund that happened to sit far from anything will tend to sit less far next period, switch or no switch. The way to rule it out is to run the identical calculation where nothing happened: the same funds, over intervals with no change of firm, with pairs of firms drawn at random from the empirical distribution of real events.
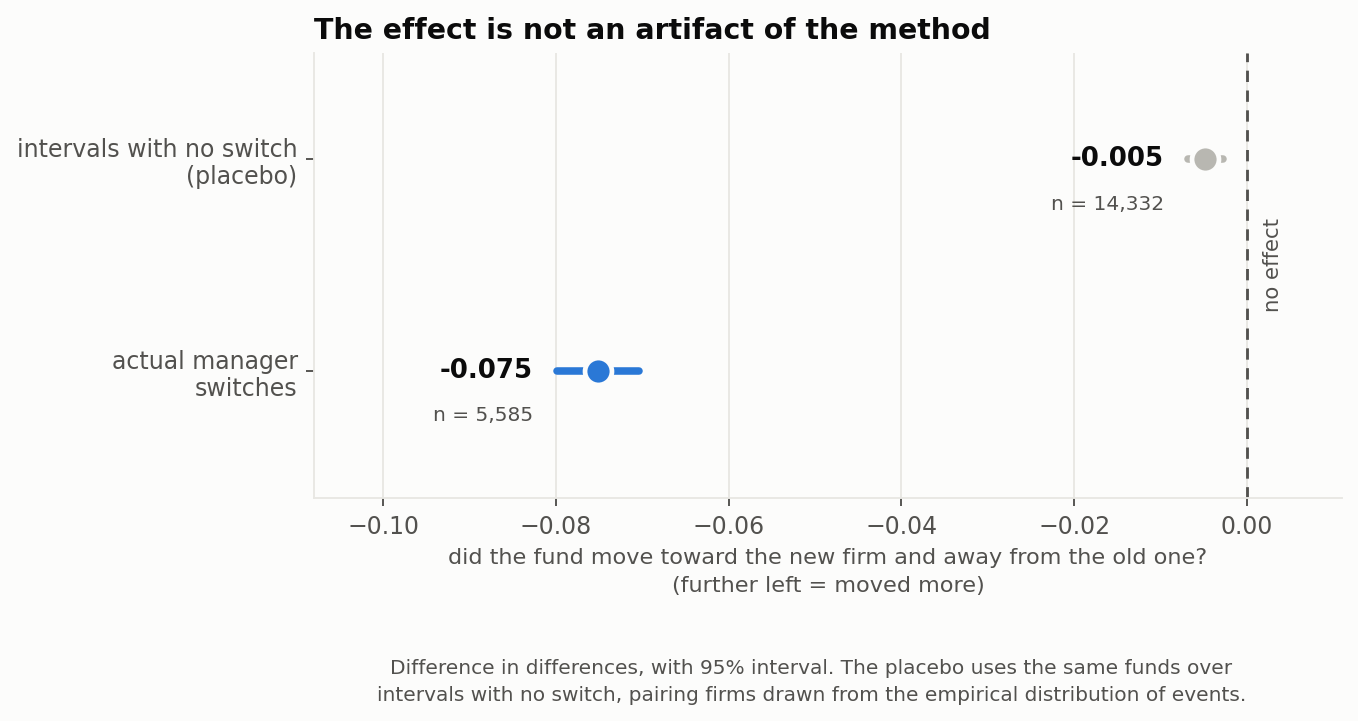
The placebo comes out at −0.005. Not zero, and with 14,332 cases almost nothing is, but sixteen times smaller than the real effect. Netting it out leaves −0.071.
The harder check is whether the fund was already migrating before the paperwork. If it was, the jump continues a move already underway instead of measuring the switch, so it is worth looking further back.
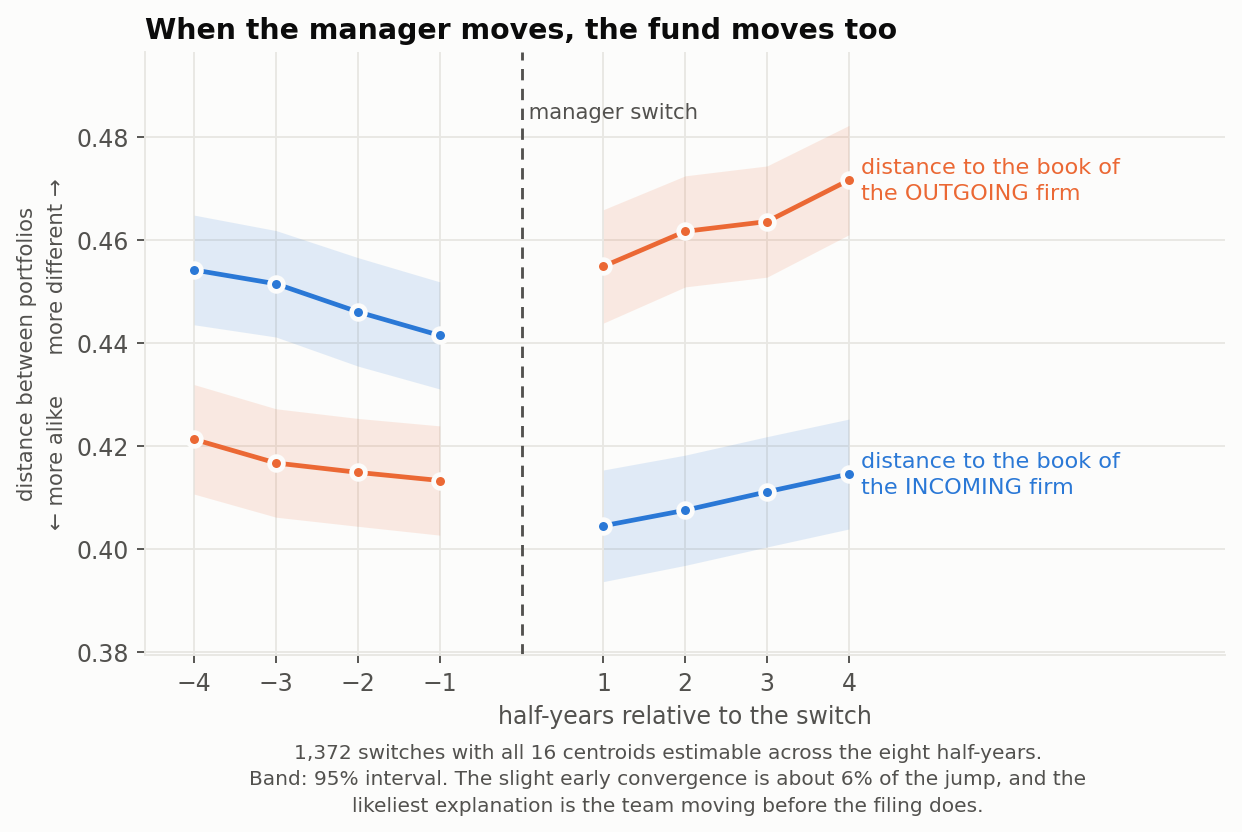
Two years out, the fund sits close to the book of the firm that runs it and far from the book of the firm that one day will. At the switch the curves cross. They are not perfectly flat beforehand: there is an early convergence toward the incoming firm worth 0.013 across the three preceding half-years, against a jump of 0.078 at the switch. So the pre-trend is real, and it accounts for about 6% of the effect. The likeliest explanation is that the team moves before the filing does.
The trajectory also shows something the before-and-after test cannot. After the switch the two curves stop behaving alike. The distance to the old firm keeps growing for two more years: 0.455, 0.462, 0.464, 0.472. The distance to the new firm starts creeping back up: 0.405, 0.408, 0.411, 0.415. The fund arrives, settles in, and then begins drifting away again.
Why this happens
Splitting portfolio variation three ways, across 29,376 funds and 1,132 management firms, puts 15% of it between firms, 49% between funds inside the same firm, and 36% within the fund over time. The firm matters without ruling. The fund is the right unit.
There is one exception, and it is the interesting one. On the decision to operate through other funds rather than buying assets directly, the firm accounts for 34% against the fund’s 42%, the only dimension where the firm comes close to outweighing the fund. The firm decides the architecture; the fund decides the allocation. That fits what the trajectory shows. The incoming firm stamps the portfolio once, on arrival, and the mandate goes on walking by itself.
Why it matters
For an investor, a manager switch is a material change to the product delivered as an administrative one. The effect is not total, since half the variation still belongs to the fund and the fund drifts back out after the initial settling. But it shows up in the first half-year, and nobody sends a letter about it.
Three limits belong in the text rather than in a footnote. The headline of 37,455 switches is the universe; the difference in differences runs on the 5,585 with all four books estimable, and the trajectory chart on the 1,372 with all sixteen measurements present. Switches in 2024 and 2025 are reported separately, because the CVM’s registry overhaul makes them a different animal: they still move portfolios (−0.086), but asymmetrically, with the fund pulling away from the old firm without converging on the new one.
And the caveat that matters most, because it is the easiest to skip past: everything above is measured on the portfolio, not on the return. That a fund comes to resemble its new firm says nothing on its own about whether its investors end up better off.
A rough check says: not much. The place to look is the Sharpe ratio, return per unit of risk, because a new firm could perfectly well deliver the same return while taking more risk to get there. Comparing the twelve months before a switch with the twelve after, the median fund’s Sharpe ratio comes out 0.13 lower afterwards. For funds that never changed hands at all, it comes out 0.13 lower too. The same number, against a spread of roughly two points between the quartiles. Whatever pulls the ratio down over that stretch has nothing to do with who is managing.
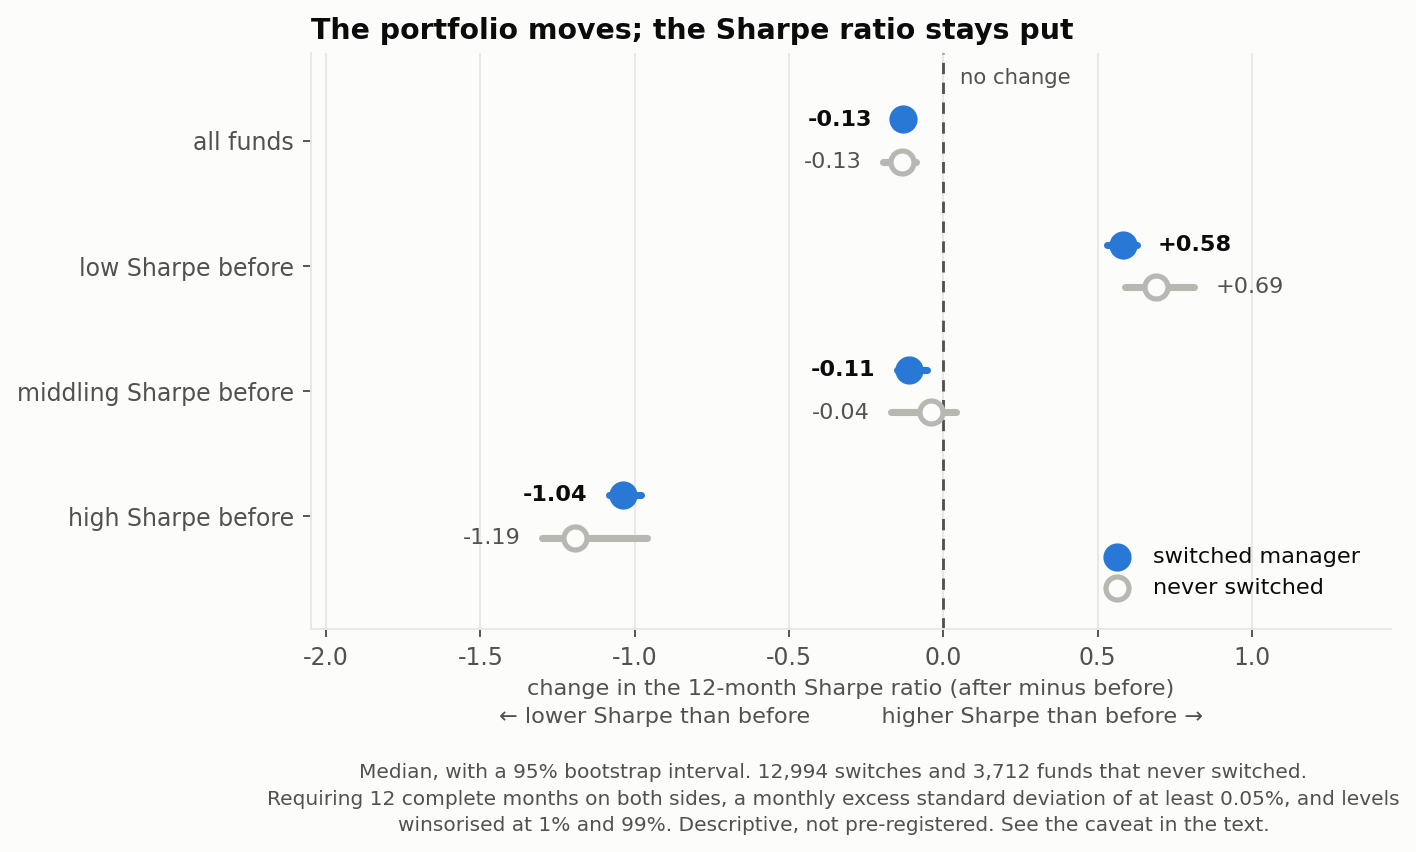
Funds that were doing badly do improve afterwards, and funds that were doing well fall back, but that happens at least as strongly without a switch, which makes it mean reversion rather than the new manager. This is descriptive rather than a pre-registered test, it only sees the funds that survived twelve months on either side, and a Sharpe ratio built from twelve monthly observations is a noisy object to begin with.
It fits what a stricter test on the same data already found. There, the strategy a fund follows explains 0.19% of the variation in its excess return over the following twelve months, while the fund’s own identity explains 21%. Having a defined strategy is not the same as being good at it. A fund can be perfectly faithful to itself for twenty years and deliver exactly the average, which is roughly what these data show happening.
NEFIN’s working papers are at Working Papers, and our public datasets at nefin.com.br/data. The figures above come from CVM’s own public filings.
Em 2003, Marianne Bertrand e Antoinette Schoar publicaram no Quarterly Journal of Economics um artigo construído em torno de uma pergunta que parece impossível de resolver. Quando uma empresa investe com cautela, se endivida com agressividade ou opera com balanço enxuto, isso é o jeito da empresa ou da pessoa que a dirige?
O experimento limpo não existe, já que ninguém sorteia executivos entre firmas. O que Bertrand e Schoar fizeram foi montar um painel casando gestores às empresas que dirigiram e, então, apoiar-se nos executivos que trocavam de emprego. Se o estilo é da pessoa, ele viaja com ela: mesmo gestor, mesmos hábitos, outro papel timbrado. E viaja mesmo, acharam elas. Boa parte do que era lançado na conta da empresa pertencia a quem estava na cadeira.
A ideia é transportável. A indústria brasileira de fundos roda esse experimento natural numa escala que painel de empresa nenhum alcança: nos registros da CVM entre 2005 e 2026 há 37.455 trocas de gestor em 24.217 fundos, cada uma um fundo mudando de casa com a carteira informada dos dois lados da mudança.
Há também um motivo prático para se importar. A troca de gestor é informada ao regulador como alteração cadastral. É pública, e não é comunicada ao cotista como mudança de produto, porque formalmente não é. Se é uma mudança na prática, essa é outra pergunta.
O que fizemos
A base é o universo completo da CVM: 55.653 fundos, 3,7 milhões de observações fundo-mês, de 2005 a 2026, incluindo os fundos que fecharam no caminho.
Comparar dois fundos exige um número, e o nosso é a fração da carteira que teria de mudar de mãos para um virar o outro:
\[d(f,g) \;=\; \frac{1}{2}\sum_{k=1}^{K}\bigl|\,w_{fk} - w_{gk}\,\bigr|\]
Aqui wfk é a fatia da carteira do fundo f que está na classe de ativo k. Dois fundos que carregam as mesmas coisas nas mesmas proporções dão d = 0, e dois fundos sem nada em comum dão d = 1. As distâncias abaixo giram em torno de 0,45, ou seja, cerca de 45% da carteira difere.
Para cada gestora, em cada semestre, construímos o livro dela: o que os fundos daquela casa carregam, em média, por classe de ativo. Depois, para cada fundo que trocou de casa, medimos a distância dele a dois livros, o da casa que entrou e o da casa que saiu, no semestre anterior à troca e no seguinte. O semestre da própria mudança fica de fora, para não confundir transição com resultado.
Um detalhe sustenta o teste inteiro: o livro de cada casa exclui o fundo que está sendo medido. Sem isso, um fundo que entra numa casa pequena puxaria a média para perto de si mesmo, e qualquer convergência que aparecesse seria aritmética.
O que encontramos
As duas distâncias se movem, em direções opostas e com quase exatamente o mesmo tamanho.
| antes | depois | ||
|---|---|---|---|
| distância ao livro da casa que entrou | 0,446 | 0,409 | aproxima |
| distância ao livro da casa que saiu | 0,421 | 0,459 | afasta |
A diferença em diferenças é de −0,075, com estatística t de −31, sobre as 5.585 trocas até 2023 em que os quatro livros são estimáveis. O espelho é o que torna o resultado legível. Um fundo se agitando ao acaso não produziria isso. Um fundo mudando de endereço produziria.
A objeção evidente tem nome, regressão à média. Um fundo que por acaso estava longe de tudo tende a ficar menos longe no período seguinte, com troca ou sem. O jeito de descartar é repetir a conta idêntica onde não aconteceu nada: os mesmos fundos, em intervalos sem mudança de casa, com pares de gestoras sorteados da distribuição real dos eventos.
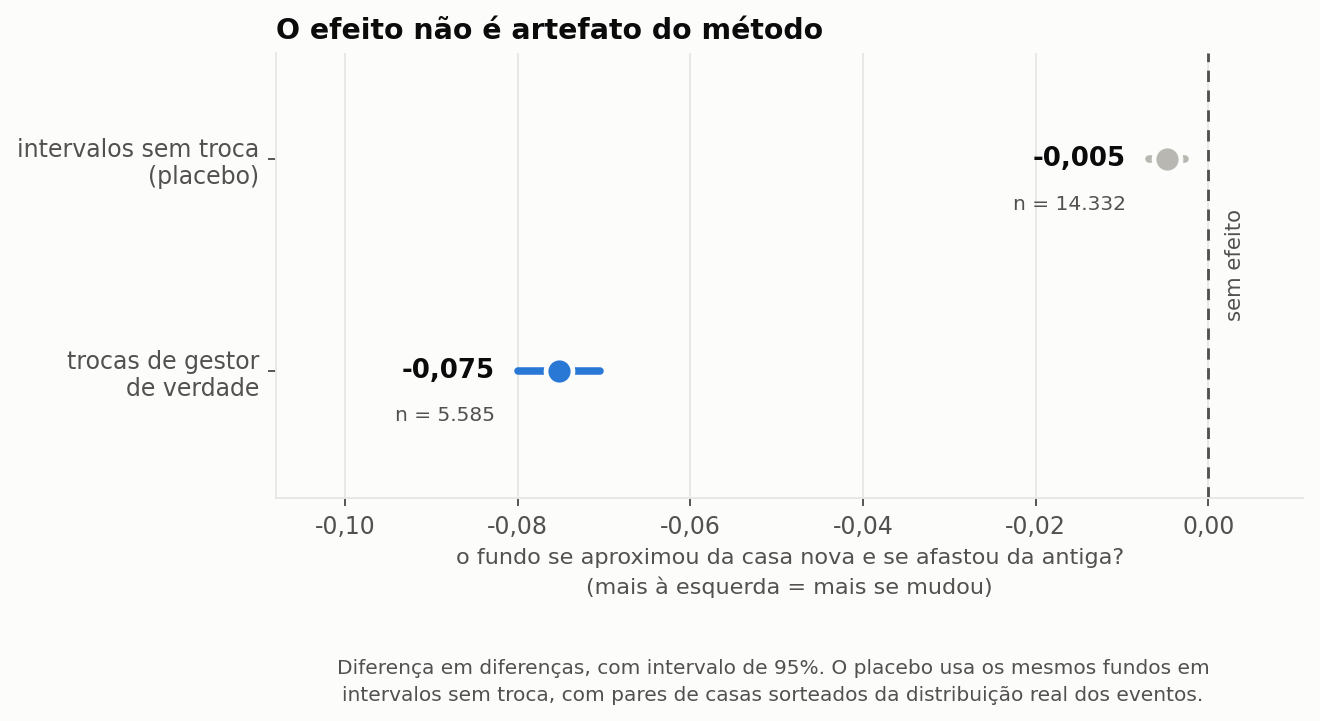
O placebo dá −0,005. Não é zero, e com 14.332 casos quase nada é, mas é dezesseis vezes menor que o efeito real. Descontando-o, sobram −0,071.
A checagem mais difícil é saber se o fundo já estava migrando antes de o papel sair. Se estivesse, o salto continuaria um movimento em curso em vez de medir a troca, então vale olhar mais para trás.
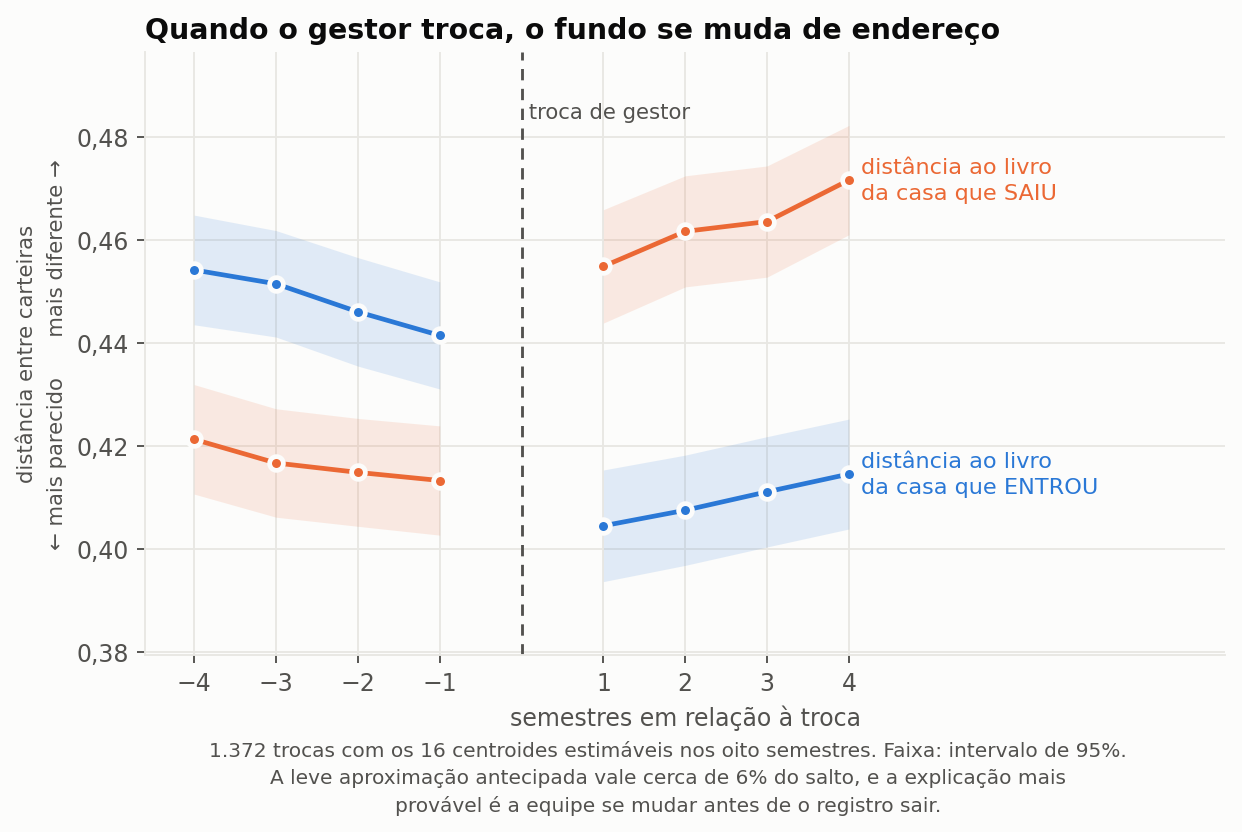
Dois anos antes, o fundo está perto do livro da casa que o gere e longe do livro da casa que um dia vai geri-lo. Na troca, as curvas se cruzam. E elas não são perfeitamente planas antes: há uma aproximação antecipada à casa nova de 0,013 ao longo dos três semestres anteriores, contra um salto de 0,078 na troca. A tendência prévia existe, portanto, e responde por cerca de 6% do efeito. A explicação mais provável é que a equipe se muda antes de o registro sair.
A trajetória mostra ainda uma coisa que o teste de antes e depois não alcança. Passada a troca, as duas curvas deixam de se comportar igual. A distância à casa antiga continua crescendo por mais dois anos: 0,455, 0,462, 0,464, 0,472. A distância à casa nova, essa, volta a subir devagar: 0,405, 0,408, 0,411, 0,415. O fundo chega, se encaixa, e depois começa a se descolar de novo.
Por que isso acontece
Partindo a variação da carteira em três, sobre 29.376 fundos e 1.132 gestoras, 15% dela fica entre casas, 49% entre fundos dentro da mesma casa e 36% dentro do fundo ao longo do tempo. A casa pesa sem mandar. O fundo é a unidade certa.
Há uma exceção, e é a interessante. Na decisão de operar por meio de outros fundos em vez de comprar ativos diretamente, a casa responde por 34% contra 42% do fundo, a única dimensão em que ela chega perto de superá-lo. A casa decide a arquitetura; o fundo decide a alocação. Bate com o que a trajetória mostra. A casa nova carimba a carteira uma vez, na entrada, e o mandato segue andando sozinho.
Por que isso importa
Para quem investe, a troca de gestor é uma alteração material no produto entregue como alteração administrativa. O efeito não é total, já que metade da variação continua sendo do fundo e o fundo volta a se descolar depois da acomodação inicial. Mas aparece já no primeiro semestre, e ninguém manda carta avisando.
Três limites ficam no texto, e não em rodapé. As 37.455 trocas são o universo; a diferença em diferenças roda sobre as 5.585 com os quatro livros estimáveis, e o gráfico da trajetória sobre as 1.372 com as dezesseis medidas presentes. As trocas de 2024 e 2025 entram reportadas à parte, porque a reorganização do registro da CVM faz delas outro animal: elas movem carteira (−0,086), mas de forma assimétrica, com o fundo se afastando da casa antiga sem convergir para a nova.
E a ressalva que mais importa, porque é a mais fácil de passar batido: tudo acima é medido na carteira, não no retorno. Que o fundo passe a se parecer com a casa nova não diz, por si só, se o cotista termina melhor.
Uma conferência grosseira diz: quase nada. O lugar de olhar é o índice de Sharpe, retorno por unidade de risco, porque a casa nova pode perfeitamente entregar o mesmo retorno correndo mais risco para chegar lá. Comparando os doze meses anteriores à troca com os doze seguintes, o Sharpe do fundo mediano termina 0,13 abaixo de onde estava. Nos fundos que nunca trocaram de casa, termina 0,13 abaixo também. O mesmo número, contra um vão de cerca de dois pontos entre os quartis. O que quer que puxe o índice para baixo naquele intervalo não tem a ver com quem está gerindo.
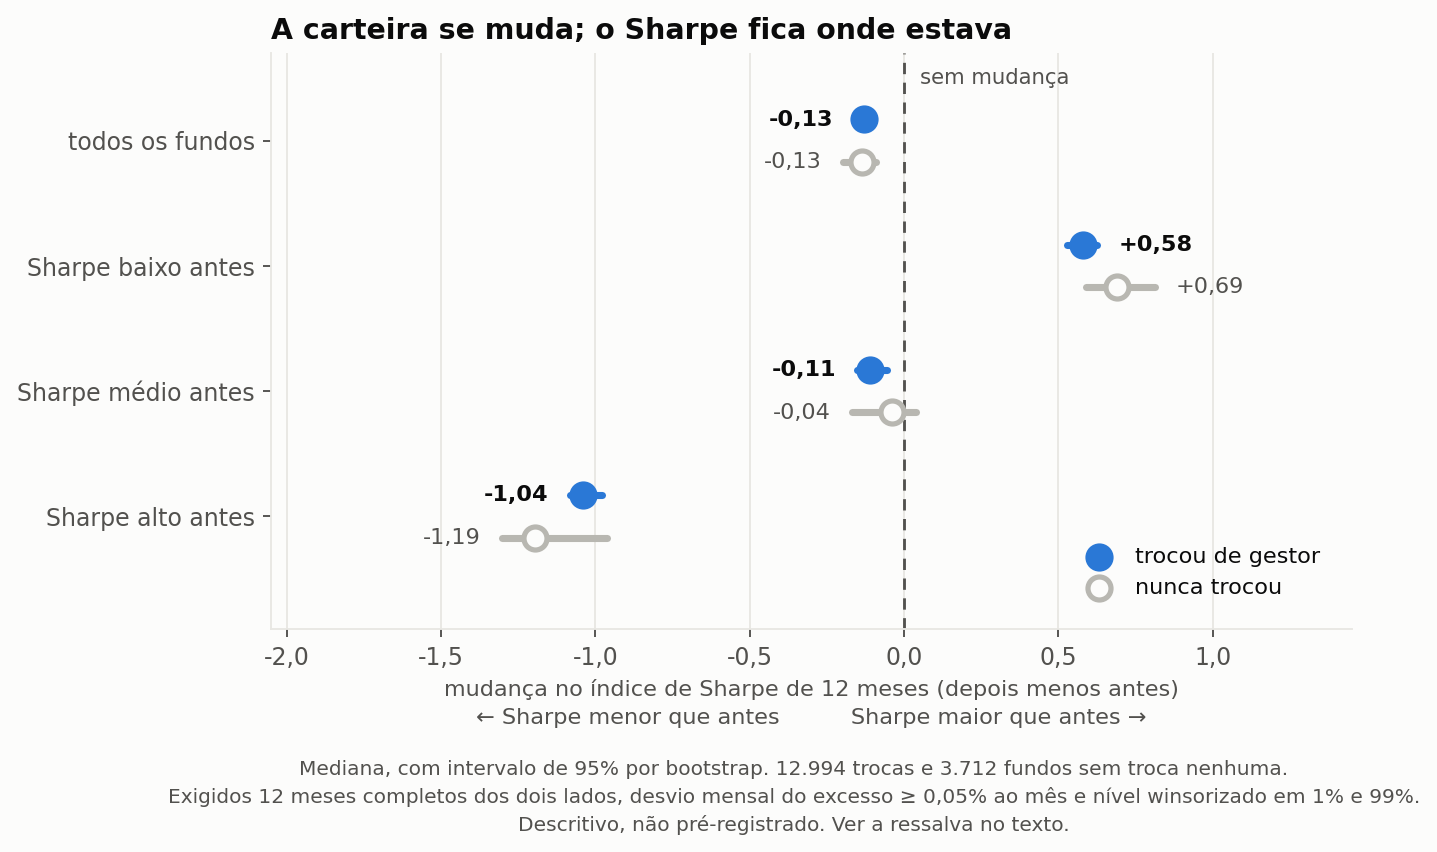
Quem ia mal de fato melhora depois, e quem ia bem recua, mas isso acontece com força pelo menos igual sem troca nenhuma, o que faz disso reversão à média e não o gestor novo. É descrição e não teste pré-registrado, só enxerga os fundos que sobreviveram doze meses de cada lado, e um Sharpe calculado sobre doze observações mensais já é, por si, objeto barulhento.
Combina com o que um teste mais rigoroso sobre os mesmos dados já tinha achado. Lá, a estratégia que um fundo segue explica 0,19% da variação do retorno excedente dele nos doze meses seguintes, e a identidade do próprio fundo explica 21%. Ter estratégia definida não é o mesmo que ser bom nela. Um fundo pode ser perfeitamente fiel a si mesmo por vinte anos e entregar exatamente a média, que é aproximadamente o que estes dados mostram acontecer.
Os working papers do NEFIN estão em Working Papers, e nossas bases públicas em nefin.com.br/data. Os números acima vêm dos informes públicos da própria CVM.
Guest contribution. The views expressed are the author's own and do not necessarily represent the position of NEFIN or the University of São Paulo.
Texto de autoria convidada. As opiniões expressas são de responsabilidade do autor e não representam necessariamente a posição do NEFIN ou da Universidade de São Paulo.